Data handling: Use experiments, simulation and probability distribution to set and explore probability models
Unit 3: Draw tree diagrams to solve probability problems
Natashia Bearam-Edmunds
Unit outcomes
By the end of this unit you will be able to:
- Draw tree diagrams when appropriate.
- Use tree diagrams to solve probability problems.
What you should know
Before you start this unit, make sure you can:
- Calculate the probability of equally likely outcomes. You can revise finding probabilities in unit 1 of this subject outcome.
Introduction
Tree diagrams are useful for organising and visualising the different possible outcomes of a sequence of events. For example, tossing a coin four times has sixteen outcomes, which can easily be organised and visualised using a tree diagram.
Draw and interpret tree diagrams
Each ‘branch’ or ‘arm’ in a tree diagram shows an outcome of an event, along with the probability of that outcome. The sum of each of the ‘branches’ will always be equal to one.
For each possible outcome of the first event, we draw a line where we write down the probability of that outcome. Then, for each possible outcome of the second event we do the same thing.
For example, if we toss a coin twice we get the following outcomes, shown on a tree diagram.

The probability of a sequence of outcomes is calculated as the product of the probabilities along the branches of the sequence. For example, the probability of getting two heads is [latex]\scriptsize 0.25[/latex].
Tree diagrams are very useful for listing the outcomes of two or more combined events as we will see in the next example.
Example 3.1
A three-digit number is formed by choosing three digits separately from three sets of numbers. The first digit is chosen from the set [latex]\scriptsize \displaystyle \left\{ {4;\text{ }5;\text{ }6} \right\}[/latex], the second digit from [latex]\scriptsize \displaystyle \left\{ {2;\text{ }3} \right\}[/latex] and the third digit from [latex]\scriptsize \displaystyle \left\{ {1;\text{ }2} \right\}[/latex]. Draw a tree diagram illustrating the possible outcomes.
Use the tree diagram to determine the probability of forming:
- the number [latex]\scriptsize \displaystyle 631[/latex]
- a number consisting of two [latex]\scriptsize \displaystyle 2\text{s}[/latex]
- a number that contains digits with a sum of eight.
Solutions
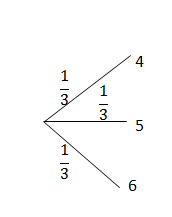
There are three events; first digit, second digit and third digit.
The first digit has three options, which are shown as three branches of the tree, each with a probability of [latex]\scriptsize \displaystyle \frac{1}{3}[/latex].
Draw the first level of the tree diagram.
The second digit has two options, with a probability of [latex]\scriptsize \displaystyle \frac{1}{2}[/latex]for each of the branches.
Draw the second level of the tree diagram.
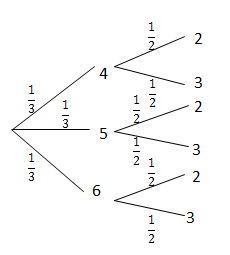
Finally, the third digit has two options with a probability of [latex]\scriptsize \displaystyle \frac{1}{2}[/latex] for each of the branches.
There are [latex]\scriptsize 12[/latex] total possible outcomes.
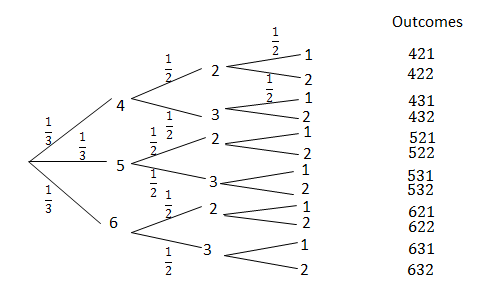
- There is only one outcome with the number [latex]\scriptsize \displaystyle 631[/latex].
[latex]\scriptsize P(631)=\displaystyle \frac{1}{3}\times \displaystyle \frac{1}{2}\times \displaystyle \frac{1}{2}=\displaystyle \frac{1}{{12}}[/latex] - There are three outcomes with two [latex]\scriptsize \displaystyle 2\text{s}[/latex], [latex]\scriptsize \{422;\text{ }522;\text{ }622\}[/latex].
.
[latex]\scriptsize \displaystyle \begin{align*}P(~2\text{ and }2)&=\displaystyle \frac{1}{{12}}+\displaystyle \frac{1}{{12}}+\displaystyle \frac{1}{{12}}\\&=\displaystyle \frac{3}{{12}}\\&=\displaystyle \frac{1}{4}\end{align*}[/latex] - There are three numbers whose digits sum to eight, [latex]\scriptsize \{422;\text{ }431;\text{ }521\text{ }\!\!\}\!\!\text{ }[/latex].
[latex]\scriptsize \begin{align*}P(\text{sum of eight})&=\displaystyle \frac{3}{{12}}\\&=\displaystyle \frac{1}{4}\end{align*}[/latex]
In unit 1 you learnt about dependent and independent events. While tree diagrams can be used for both dependent and independent events, they are less useful for independent events since we can just multiply the probabilities of separate events to get the probability of the combined event as you saw in example 3.1. Remember that for independent events:
[latex]\scriptsize P(\text{A and B)}=P(\text{A)}\cdot P(\text{B)}[/latex]
Tree diagrams are very helpful for analysing dependent events. A tree diagram allows you to show how each possible outcome of one event affects the probabilities of the other events.
So if you already know that events are independent, it is usually easier to solve a problem without using tree diagrams. But if you are uncertain about whether events are independent, or if you know that they are not, you should use a tree diagram.
Example 3.2
Jackie is a street magician and would like to draw aces one after the other from an ordinary deck of [latex]\scriptsize 52[/latex] playing cards. Use a tree diagram to find the probability he draws:
- two aces
- no aces
- exactly one ace
- at least one ace.
Solutions
Let A be the event drawing an ace. Let O be the event of getting any other card.
Since there are four aces in a deck of cards the probability of getting an ace on the first draw is [latex]\scriptsize \displaystyle \frac{4}{{52}}[/latex]. Therefore the probability of getting any other card is [latex]\scriptsize 1-\displaystyle \frac{4}{{52}}=\displaystyle \frac{{48}}{{52}}[/latex].
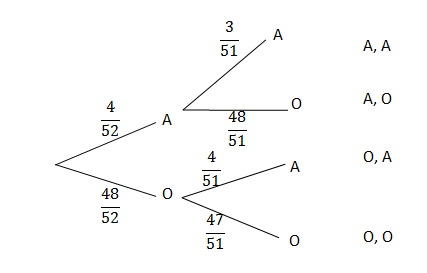
After the first card is drawn there will be [latex]\scriptsize 51[/latex] cards left in the pack. If the first card drawn is an ace, then the probability of getting another ace is [latex]\scriptsize \displaystyle \frac{3}{{51}}[/latex] as shown in the second level of the tree diagram. If the first card drawn is any other card, then the probability of getting an ace on the second draw is [latex]\scriptsize \displaystyle \frac{4}{{51}}[/latex].
- .
[latex]\scriptsize \begin{align*}P(\text{A and A)}&=\displaystyle \frac{4}{{52}}\cdot \displaystyle \frac{3}{{51}}\\&=\displaystyle \frac{1}{{221}}\end{align*}[/latex] - The probability of getting no aces means that other cards were drawn both times.
[latex]\scriptsize \begin{align*}P(\text{{A}'})&=P(\text{O and O)}\\&=\displaystyle \frac{{48}}{{52}}\cdot \displaystyle \frac{{47}}{{51}}\\&=\displaystyle \frac{{188}}{{221}}\end{align*}[/latex] - The probability of exactly one ace is the outcome (A,O) plus (O,A).
[latex]\scriptsize \begin{align*}P(\text{exactly one A)}&=P(\text{A and O)}+P(\text{O and A)}\\&=\displaystyle \frac{4}{{52}}\cdot \displaystyle \frac{{48}}{{51}}+\displaystyle \frac{{48}}{{52}}\cdot \displaystyle \frac{4}{{51}}\\&=\displaystyle \frac{{32}}{{221}}\end{align*}[/latex] - The probability of at least one ace means one or more aces are drawn, which is the sum of 1. and 3. above.
[latex]\scriptsize \begin{align*}P(\text{at least one ace)}&=\displaystyle \frac{1}{{221}}+\displaystyle \frac{{32}}{{221}}\\&=\displaystyle \frac{{33}}{{221}}\end{align*}[/latex]
Exercise 3.1
- What is the probability of throwing at least one five in three rolls of a regular six-sided die? Hint: do not show all possible outcomes of each roll of the die. We are interested in whether the outcome is five or not five only.
- A bag contains [latex]\scriptsize \displaystyle 10[/latex] orange balls and seven black balls. You draw three balls from the bag without replacement. What is the probability that you will end up with exactly two orange balls? Represent this experiment using a tree diagram.
- A person takes part in a medical trial that tests the effect of a medicine on a disease. Half the people are given medicine while the other half are given a sugar pill, which has no effect on the disease. The medicine has a [latex]\scriptsize \displaystyle 60\%[/latex] chance of curing the disease. But people who do not get the medicine still have a [latex]\scriptsize \displaystyle 10\%[/latex] chance of getting well. There are [latex]\scriptsize \displaystyle 50[/latex] people in the trial and they all have the disease. Tammy takes part in the trial, but we do not know whether she was given the medicine or the sugar pill. Draw a tree diagram of all the possible cases. What is the probability that Tammy gets cured?
The full solutions are at the end of the unit.
Summary
In this unit you have learnt the following:
- How to draw a tree diagram.
- When to use a tree diagram.
- How to calculate probabilities from a tree diagram.
Unit 3: Assessment
Suggested time to complete: 45 minutes
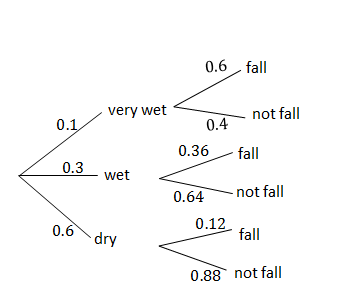
- The probability that the floor of a supermarket will be wet when it opens in the morning is [latex]\scriptsize \displaystyle 30\%[/latex] and there is a [latex]\scriptsize \displaystyle 10\%[/latex] probability of the floor being very wet. The probability that a person will slip and fall if the floor is dry is [latex]\scriptsize \displaystyle 12\%[/latex] and a person is three times more likely to fall if the floor is wet. If the floor is very wet, the probability that a person will fall is [latex]\scriptsize \displaystyle 0.6[/latex]. Draw a tree diagram to represent the given information, showing the probabilities of each outcome, and use it to answer the following questions:
- What is the probability that a person will fall on any given day?
- What is the probability that a person will not fall on any given day?
- Are the events of the floor being dry and a person falling independent? Justify your answer with a calculation.
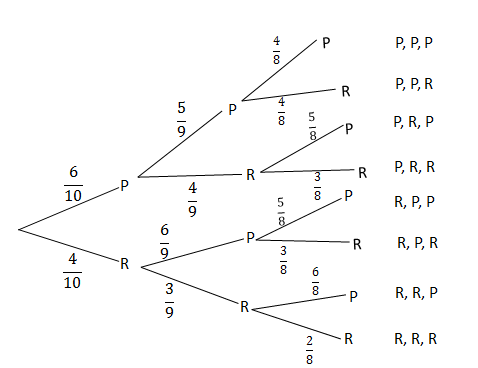
- Tandi has [latex]\scriptsize \displaystyle 10[/latex] bottles of nail polish in her handbag. Four of the bottles are red, and six are pink. She removes a bottle at random from the bag but does not replace it. She then chooses a second bottle at random and does not replace it and chooses a third bottle.
- Draw a tree diagram to show all possible outcomes.
- Determine the probability of her choosing a red bottle followed by another red bottle.
- The following tree diagram represents points scored by two teams in a soccer game. At each level in the tree, the points are shown as (points for Team 1; points for Team 2).
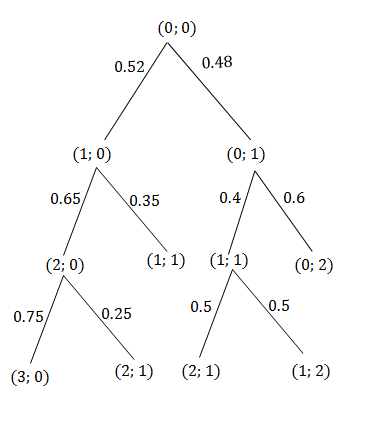
.
Use this diagram to determine the probability that:- Team 1 will win
- the game will be a draw
- the game will end with an even number of total points.
The full solutions are at the end of the unit.
Unit 3: Solutions
Exercise 3.1
- .
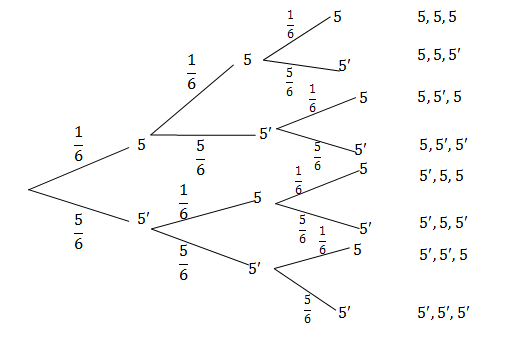
[latex]\scriptsize \begin{align*}&P(\text{at least one }5)=P(5,5,5)+P(5,5,{5}')+P(5,5',5)+P(5,5',5')+\\&P(5',5,5)+P(5',5,{5}')+P(5',{5}',5)\\&=\displaystyle \frac{1}{6}\cdot \displaystyle \frac{1}{6}\cdot \displaystyle \frac{1}{6}+\displaystyle \frac{1}{6}\cdot \displaystyle \frac{1}{6}\cdot \displaystyle \frac{5}{6}+\displaystyle \frac{1}{6}\cdot \displaystyle \frac{5}{6}\cdot \displaystyle \frac{1}{6}+\displaystyle \frac{1}{6}\cdot \displaystyle \frac{5}{6}\cdot \displaystyle \frac{5}{6}+\displaystyle \frac{5}{6}\cdot \displaystyle \frac{1}{6}\cdot \displaystyle \frac{1}{6}\\&+\displaystyle \frac{5}{6}\cdot \displaystyle \frac{1}{6}\cdot \displaystyle \frac{5}{6}+\displaystyle \frac{5}{6}\cdot \displaystyle \frac{5}{6}\cdot \displaystyle \frac{1}{6}\\&=\displaystyle \frac{{91}}{{216}}\end{align*}[/latex] - Let O be the event choosing an orange ball.
Let B be the event choosing a black ball.
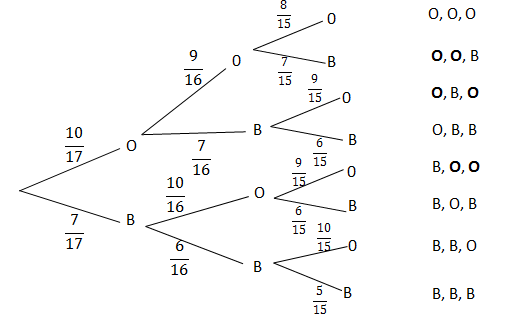
[latex]\scriptsize \begin{align*}P(\text{exactly 2 orange balls})&=\left( {\displaystyle \frac{{10}}{{17}}\cdot \displaystyle \frac{9}{{16}}\cdot \displaystyle \frac{7}{{15}}} \right)+\left( {\displaystyle \frac{{10}}{{17}}\cdot \displaystyle \frac{7}{{16}}\cdot \displaystyle \frac{9}{{15}}} \right)+\left( {\displaystyle \frac{7}{{17}}\cdot \displaystyle \frac{{10}}{{16}}\cdot \displaystyle \frac{9}{{15}}} \right)\\&=\displaystyle \frac{{21}}{{136}}+\displaystyle \frac{{21}}{{136}}+\displaystyle \frac{{21}}{{136}}\\&=\displaystyle \frac{{63}}{{136}}\end{align*}[/latex] - There are two uncertain events in this problem. Each person receives either medicine (probability [latex]\scriptsize \displaystyle \frac{1}{2}[/latex]) or a sugar pill (probability [latex]\scriptsize \displaystyle \frac{1}{2}[/latex]). Each person either gets cured (probability [latex]\scriptsize \displaystyle \frac{3}{5}[/latex] with medicine and [latex]\scriptsize \displaystyle \frac{1}{{10}}[/latex]without) or stays ill (probability [latex]\scriptsize \displaystyle \frac{2}{5}[/latex] with medicine and [latex]\scriptsize \displaystyle \frac{9}{{10}}[/latex]without).
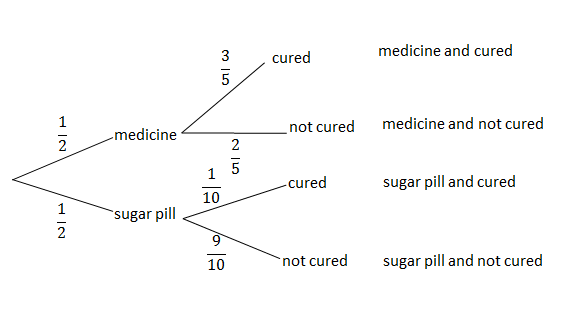
[latex]\scriptsize \begin{align*}P(\text{cured)}&=P(\text{medicine and cured})+P(\text{sugar pill and cured})\\&=\displaystyle \frac{1}{2}\cdot \displaystyle \frac{3}{5}+\displaystyle \frac{1}{2}\cdot \displaystyle \frac{1}{{10}}\\&=\displaystyle \frac{7}{{20}}\end{align*}[/latex]
The probability that Tammy is cured is [latex]\scriptsize \displaystyle \frac{7}{{20}}[/latex].
Unit 3: Assessment
- .
- .
[latex]\scriptsize \begin{align*}P(\text{fall})&=P(\text{very wet and fall})+P(\text{wet and fall})+P(\text{dry and fall})\\&=0.1\times 0.6+0.3\times 0.36+0.6\times 0.12\\&=0.24\end{align*}[/latex] - .
[latex]\scriptsize \begin{align*}P(\text{not falling})&=1-P(\text{fall})\\&=1-0.24\\&=0.76\end{align*}[/latex] - .
[latex]\scriptsize \begin{align*}P(\text{dry and fall})&=0.072\\P(\text{dry})\times P(\text{fall})&=0.6\times 0.24\\&=0.144\\P(\text{dry and fall})&\ne P(\text{dry})\times P(\text{fall})\\\therefore &\text{the floor being dry and a person falling are dependent events}\text{.}\end{align*}[/latex]
- .
- .
- .
- .
[latex]\scriptsize \begin{align*}P(\text{red followed by red})&=P(\text{P, R, R})+P(\text{R, R, P})+P(\text{R, R, R})\\&=\left( {\displaystyle \frac{6}{{10}}\cdot \displaystyle \frac{4}{9}\cdot \displaystyle \frac{3}{8}} \right)+\left( {\displaystyle \frac{4}{{10}}\cdot \displaystyle \frac{3}{9}\cdot \displaystyle \frac{6}{8}} \right)+\left( {\displaystyle \frac{4}{{10}}\cdot \displaystyle \frac{3}{9}\cdot \displaystyle \frac{2}{8}} \right)\\&=\displaystyle \frac{7}{{30}}\end{align*}[/latex]
- .
- .
- .
[latex]\scriptsize \displaystyle \begin{align*}P(\text{team one wins})&=P(3;\text{ }0)+P(2;\text{ }1)+P(2;\text{ }1)\\&=(0.52\times 0.65\times 0.75)+(0.52\times 0.65\times 0.25)+(0.48\times 0.4\times 0.5)\\&=0.434\end{align*}[/latex] - .
[latex]\scriptsize \begin{align*}P(\text{draw})&=P(1;\text{ }1)\\&=0.52\times 0.35\\&=0.182\end{align*}[/latex] - .
[latex]\scriptsize \begin{align*}P(\text{even number})&=P(1;\text{ }1)+P(0;\text{ }2)\\&=0.52\times 0.35+0.48\times 0.6\\&=0.47\end{align*}[/latex]
- .
Media Attributions
- Fig 1 Tree diagram 2 coin toss © DHET is licensed under a CC BY (Attribution) license
- Fig 2 Example 3.1 © DHET is licensed under a CC BY (Attribution) license
- Fig 2.2 Example 3.1 2nd level © DHET is licensed under a CC BY (Attribution) license
- Fig 2.4 Example 3.1 final tree diag © DHET is licensed under a CC BY (Attribution) license
- Fig 3 Example 3.2 © DHET is licensed under a CC BY (Attribution) license
- Fig 7 Assess Q3 © DHET is licensed under a CC BY (Attribution) license
- Fig 4 Exercise 3.1 Q1 Ans © DHET is licensed under a CC BY (Attribution) license
- Fig 5 Exercise 3.1 Q2 Ans © DHET is licensed under a CC BY (Attribution) license
- Fig 6 Exercise 3.1 Q3 Ans © DHET is licensed under a CC BY (Attribution) license
- Fig 8 Assess Q1 Ans © DHET is licensed under a CC BY (Attribution) license
- Fig 9 Assess Q2 © DHET is licensed under a CC BY (Attribution) license
