Data handling: Use experiments, simulation and probability distribution to set and explore probability models
Unit 2: Draw Venn diagrams to solve probability problems
Natashia Bearam-Edmunds
Unit outcomes
By the end of this unit you will be able to:
- Understand when to use Venn diagrams.
- Draw Venn diagrams.
- Interpret Venn diagrams.
What you should know
Before you start this unit, make sure you can:
- calculate the probability of an outcome. To revise probability calculations see unit 1 of this subject outcome.
Introduction
The outcomes of an experiment can be represented using sets, Venn diagrams, tree diagrams and contingency tables. Tree diagrams and contingency tables will be discussed in units 3 and 4. In this unit we use Venn diagrams to represent the sample space of compound events.
Draw and interpret Venn diagrams
A Venn diagram is a graphical way to represent the relationships between sets. A Venn diagram can be very helpful with probability calculations. In probability, a Venn diagram is used to show how two or more events are related to each another.
In a Venn diagram each event is represented by a shape, often a circle. The area inside the shape shows the outcomes included in the event and the region outside the shape shows the outcomes that are not in the event. The rectangle, drawn around the circles, shows all the outcomes contained in the sample space.
Consider two events, A and B, in a sample space S. Figure 1 shows the sample space S as a rectangle and the two events A and B as circles. The possible ways in which the events can overlap are represented using Venn diagrams.
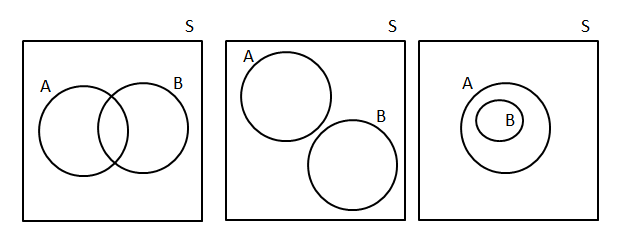
In the first case the two events overlap partially and [latex]\scriptsize \text{n(A}\cap \text{B)} \gt 1[/latex]: these are mutually inclusive events. In the second case the two events do not overlap at all. [latex]\scriptsize \text{n(A}\cap \text{B)}=0[/latex]: these are mutually exclusive events. In the third case event B is fully contained in event A, and [latex]\scriptsize \text{A}\cap \text{B}=\text{B}[/latex]: these are mutually inclusive events.
Note: events will always appear inside the sample space since the sample space contains all possible outcomes of the experiment.
Note
This video shows how to draw a Venn diagram using a deck of playing cards as the sample space, “Probability with playing cards and Venn diagrams”.
Example 2.1
Anna thinks of a number between one and [latex]\scriptsize 10[/latex]. Draw a Venn diagram to answer the following questions.
- What is the probability that the number is a multiple of two?
- What is the probability that the number is a multiple of three?
- What is the probability that the number is a multiple of two or three?
- What is the probability that the number is a multiple of two and three?
- What is the probability that the number is NOT a multiple of two or three?
Solutions
Step 1: Draw the Venn diagram
The Venn diagram should show the sample space containing all numbers from one to [latex]\scriptsize 10[/latex]. Let [latex]\scriptsize \text{A}[/latex] be the event that contains all the multiples of two, [latex]\scriptsize \text{A}=\{2;\text{ }4;\text{ }6;\text{ }8;\text{ }10\}[/latex]. Let [latex]\scriptsize \text{B}[/latex] be the event that contains all the multiples of three, [latex]\scriptsize \text{B}=\{3;\text{ 6};\text{ 9}\}[/latex] .
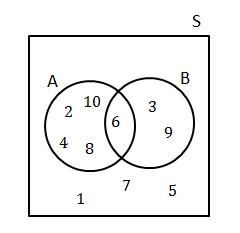
We see that there are ten outcomes. The intersection of the two events is [latex]\scriptsize 6[/latex] and the outcomes [latex]\scriptsize 1;\text{ }7;\text{ }5[/latex] are not part of either event.
Step 2: Calculate the probabilities
Remember that the probability of an event is the number of outcomes in the event set divided by the number of outcomes in the sample space.
[latex]\scriptsize \displaystyle \begin{align*}\text{P}(\text{E})&=\text{ }\displaystyle \frac{{\text{number of favourable outcomes}}}{{\text{number of possible outcomes}}}\\&=\displaystyle \frac{{n(\text{E})}}{{n(\text{S})}}\end{align*}[/latex]
- Since there are five outcomes in event [latex]\scriptsize \text{A}[/latex], the probability of a multiple of two is:
[latex]\scriptsize \displaystyle \begin{align*}\text{P}(\text{A})&=\displaystyle \frac{5}{{10}}\\&=\displaystyle \frac{1}{2}\end{align*}[/latex] - Since there are three outcomes in event [latex]\scriptsize \text{B}[/latex], the probability of a multiple of three is:
[latex]\scriptsize \displaystyle \text{P}(\text{B})=\displaystyle \frac{3}{{10}}[/latex] - The event that the number is a multiple of two or three is the union of the above two event sets. There are seven elements in the union of the event sets, so the probability is [latex]\scriptsize \displaystyle \frac{7}{{10}}[/latex]. This can be calculated as:
[latex]\scriptsize \displaystyle \begin{align*}P(\text{A or B})&=P(\text{A})+P(\text{B)}-P(\text{A}\cap \text{B})\\&=\displaystyle \frac{5}{{10}}+\displaystyle \frac{3}{{10}}-\displaystyle \frac{1}{{10}}\\&=\displaystyle \frac{7}{{10}}\end{align*}[/latex] - The event that the number is a multiple of two and three is the intersection of the two event sets. There is one element in the intersection of the event sets, so [latex]\scriptsize \displaystyle P(\text{A}\cap \text{B})=\displaystyle \frac{1}{{10}}[/latex].
- The event ‘NOT a multiple of two or three’ is the set of all numbers not in events [latex]\scriptsize \text{A}[/latex] or [latex]\scriptsize \text{B}[/latex]. This is the complement of events [latex]\scriptsize \text{A}[/latex] or [latex]\scriptsize \text{B}[/latex].
[latex]\scriptsize \begin{align*}P(\text{not A or B)}&=1-\displaystyle \frac{7}{{10}}\\&=\displaystyle \frac{3}{{10}}\end{align*}[/latex]
Example 2.2
In a group of [latex]\scriptsize \displaystyle 50[/latex] learners, [latex]\scriptsize 35[/latex] take mathematics and [latex]\scriptsize 30[/latex] take science, while [latex]\scriptsize 12[/latex] take neither of the two subjects. Draw a Venn diagram representing this information. If a learner is chosen at random from this group, what is the probability that they take both mathematics and science?
Solution
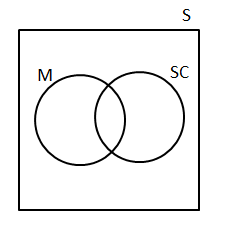
Step 1: Draw an outline of Venn diagram
Let [latex]\scriptsize \text{M}[/latex] be the event ‘takes mathematics’.
Let [latex]\scriptsize \text{SC}[/latex] be the event ‘takes science’.
We need to do some calculations before drawing the full Venn diagram, but with the information given we can already draw the outline.
Step 2: Write down sizes of the event sets, their union and intersection
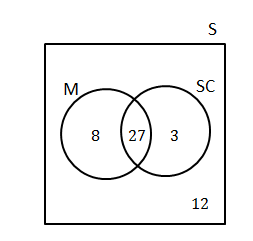
We are told that [latex]\scriptsize 12[/latex] learners take neither of the two subjects. Graphically we can represent this outside the two events in the Venn diagram.
Since there are [latex]\scriptsize \displaystyle 50[/latex] learners in the sample space, we can see that there are [latex]\scriptsize 50-12=38[/latex] elements in [latex]\scriptsize \text{M or SC}[/latex]. So far we know:
[latex]\scriptsize n(\text{M)}=35[/latex]
[latex]\scriptsize n(\text{SC)}=30[/latex]
[latex]\scriptsize n(\text{M or SC)}=38[/latex]
We need to find the intersection of the two events to complete the Venn diagram.
From the addition rule:
[latex]\scriptsize \begin{align*}n(\text{M }\cup \text{ SC)}&=n(\text{M)}+n(\text{SC)}-n(\text{M}\cap \text{SC})\\\therefore n(\text{M}\cap \text{SC})&=35+30-38\\&=27\end{align*}[/latex]
Step 3: Draw the final Venn diagram
Step 4: Calculate the probability
[latex]\scriptsize P(\text{M}\cap \text{SC)}=\displaystyle \frac{{27}}{{50}}[/latex]
Example 2.3
Use the following information to draw a Venn diagram. Then using the Venn diagram, find[latex]\scriptsize P\left( {\text{B and (not A)}} \right)[/latex].
[latex]\scriptsize \begin{align*}P(\text{A})&=0.3\\P(\text{A and B)}&=0.2\\P(\text{B})&=0.7\end{align*}[/latex]
Solution
Step 1: Calculate the probabilities of each event only
Start with the intersection and work out the probability of each event only.
Since [latex]\scriptsize P(\text{A and B)}=0.2[/latex]
[latex]\scriptsize \begin{align*}P(\text{A only})&=0.3-0.2\\&=0.1\\P(\text{B only})&=0.7-0.2\\&=0.5\end{align*}[/latex]
Therefore the probability of not being in event [latex]\scriptsize \text{A}[/latex]or [latex]\scriptsize \text{B}[/latex] is [latex]\scriptsize 1-(0.1+02+0.5)=0.2[/latex].
Step 2: Draw the Venn diagram showing the probabilities of the events
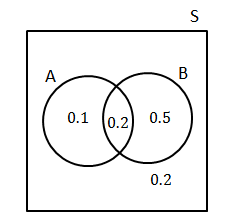
Step 3: Write down the solution
[latex]\scriptsize P\left( {\text{B and (not A)}} \right)[/latex]i s the same as probability of [latex]\scriptsize \text{B}[/latex] only.
[latex]\scriptsize P\left( {\text{B and (not A)}} \right)=0.5[/latex]
Exercise 2.1
- You are given the following information:
[latex]\scriptsize \begin{align*}P(\text{A})=0.5\\P(\text{A and B)}=0.2\\P(\text{not B})=0.6\end{align*}[/latex]
Draw a Venn diagram to represent this information and determine [latex]\scriptsize \displaystyle P(\text{A or B})[/latex]. - In a group of [latex]\scriptsize \displaystyle 42[/latex] learners, all but three had a packet of chips or a cool drink or both. If [latex]\scriptsize \displaystyle 23[/latex] had a packet of chips and seven of these also had a cool drink, what is the probability that a learner chosen at random has:
- both chips and a cool drink?
- only cool drink?
- In a survey at a college, [latex]\scriptsize \displaystyle 80[/latex] people were asked if they read the Daily News or the Newshound newspapers, or both. The survey revealed that [latex]\scriptsize \displaystyle 45[/latex] read the Daily News, [latex]\scriptsize \displaystyle 30[/latex] read the Newshound and [latex]\scriptsize \displaystyle 10[/latex] read neither. Use a Venn diagram to find the percentage of people who read:
- only the Daily News
- only the Newshound
- both the Daily News and the Newshound.
The full solutions are at the end of the unit.
Summary
In this unit you have learnt the following:
- How to draw a Venn diagram.
- How to use a Venn diagram to answer probability questions.
- How to complete a Venn diagram.
Unit 2: Assessment
Suggested time to complete: 45 minutes
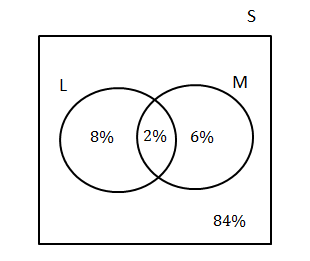
- In a group of learners, [latex]\scriptsize \displaystyle 10\%[/latex] are left-handed, [latex]\scriptsize \displaystyle 8\%[/latex] are short-sighted and [latex]\scriptsize \displaystyle 2\%[/latex] are left-handed and short-sighted.
- Draw a Venn diagram to illustrate the above information.
- What is the probability that a randomly chosen learner from the group is left-handed or short sighted?
- What is the probability that a randomly chosen learner from the group is not left-handed?
- In a group of [latex]\scriptsize \displaystyle 85[/latex] girls, [latex]\scriptsize \displaystyle 48[/latex] play hockey, [latex]\scriptsize \displaystyle 43[/latex] play tennis and [latex]\scriptsize \displaystyle 12[/latex] do not play hockey or tennis.
- Draw a Venn diagram to illustrate this information and use it to determine how many girls play both hockey and tennis.
- What is the probability that a girl chosen at random, does not play hockey?
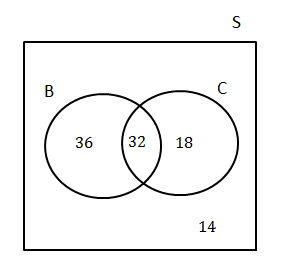
- There were [latex]\scriptsize \displaystyle 100[/latex] teenagers eating at a restaurant over the weekend, [latex]\scriptsize \displaystyle 68[/latex] of them had burgers, [latex]\scriptsize \displaystyle 50[/latex] ate chicken and [latex]\scriptsize \displaystyle 32[/latex] ate burgers and chicken.
- Draw a Venn diagram to illustrate the given data.
- Use the Venn diagram to find the probability that a randomly chosen person did not eat burgers or chicken.
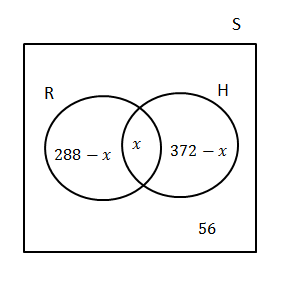
- NBE high school offers only two sporting activities; rugby and hockey.
.
The following information is given:-
- There are [latex]\scriptsize \displaystyle 600[/latex] learners in the school.
- [latex]\scriptsize \displaystyle 372[/latex] learners play hockey.
- [latex]\scriptsize \displaystyle 288[/latex] learners play rugby.
- [latex]\scriptsize \displaystyle 56[/latex] of the learners play no sport.
- The number of learners that play both rugby and hockey is [latex]\scriptsize \displaystyle x[/latex].
-
-
- Represent the given information in a Venn diagram, in terms of [latex]\scriptsize \displaystyle x[/latex].
- Calculate the value of [latex]\scriptsize \displaystyle x[/latex].
- Are the events playing rugby and playing hockey mutually exclusive? Justify your answer.
The full solutions are at the end of the unit.
Unit 2: Solutions
Exercise 2.1
- .
[latex]\scriptsize \begin{align*}P(\text{A only})&=0.5-0.2\\&=0.3\\P(\text{not B})&=0.6\\\text{since }P(\text{A only})&=0.3\text{ then the probability of not A and not B is }0.3\\\therefore P(\text{B only})&=1-(0.3+0.2+0.3)\\&=0.2\end{align*}[/latex]
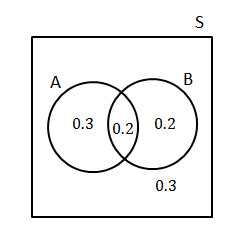
.
[latex]\scriptsize \displaystyle \begin{align*}P(\text{A or B})&=0.3+0.2+0.2\\&=0.7\end{align*}[/latex] - Let [latex]\scriptsize \text{A}[/latex] be the event ‘packet of chips’
Let [latex]\scriptsize \text{B}[/latex] be the event ‘cool drink’.
[latex]\scriptsize \begin{align*}n(A\cup B)&=42-3=39\\n(A)&=23\\n(A\cap B)&=7\\n(A\cup B)&=n(A)+n(B)-n(A\cap B)\\n(B)&=n(A\cup B)-n(A)+n(A\cap B)\\&=39-23+7\\&=23\end{align*}[/latex]
The Venn diagram:
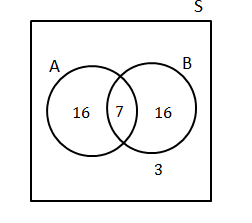
- .
[latex]\scriptsize \begin{align*}P(\text{A and B)}&=\displaystyle \frac{7}{{42}}\\&=\displaystyle \frac{1}{6}\end{align*}[/latex] - .
[latex]\scriptsize \begin{align*}P(\text{only B)}&=\displaystyle \frac{{16}}{{42}}\\&=\displaystyle \frac{8}{{21}}\end{align*}[/latex]
- .
- Let D be the event read the Daily News
Let N be the event read the Newshound
[latex]\scriptsize \displaystyle 70[/latex] people read the Daily News or Newshound newspaper or both.
[latex]\scriptsize \begin{align*}n(D\cup N)&=80-10=70\\n(D)&=45\\N(N)&=30\\n(D\cup N)&=n(D)+n(N)-n(D\cap N)\\N(D\cap N)&=n(D)+n(N)-n(D\cup N)\\&=45+30-70\\&=5\end{align*}[/latex]
[latex]\scriptsize \displaystyle 45+30-70=5[/latex] gives the intersection of the events.
The Venn diagram shows this information:
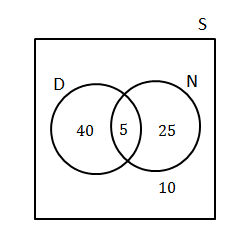
- [latex]\scriptsize \displaystyle \frac{{40}}{{80}}\times 100=50\%[/latex] read only the Daily News
- [latex]\scriptsize \displaystyle \frac{{25}}{{80}}\times 100=31.25\%[/latex]read only the Newshound
- [latex]\scriptsize \displaystyle \frac{5}{{80}}\times 100=6.25\%[/latex]read both the Daily News and the Newshound
Unit 2: Assessment
- Let L be ‘left-handed’
Let M be ‘short-sighted’- .
- .
[latex]\scriptsize \begin{align*}P(\text{L or M})&=P(\text{L)}+P\text{(M})-P\text{(L }\text{and M)}\\&=10\%+8\%-2\%\\&=16\%\end{align*}[/latex] - .
[latex]\scriptsize \begin{align*}P(\text{not left handed})&=1-P(L)\\&=90\%\end{align*}[/latex]
- .
- T [latex]\scriptsize =[/latex] play tennis
H [latex]\scriptsize =[/latex] play hockey- .
[latex]\scriptsize \begin{align*}n(H\cup T)&=85-12=73\\n(H)&=48\\n(T)&=43\\n(H\cup T)&=n(H)+n(T)-n(H\cap T)\\n(H\cap T)&=n(H)+n(T)-n(H\cup T)\\&=48+43-73\\&=18\end{align*}[/latex]
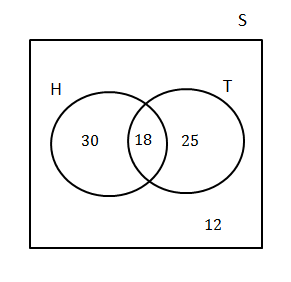
18 girls play both hockey and tennis. - .
[latex]\scriptsize \begin{align*}P(\text{{H}'})&=1-\displaystyle \frac{{48}}{{85}}\\&=\displaystyle \frac{{37}}{{85}}\end{align*}[/latex]
- .
- B [latex]\scriptsize =[/latex] burgers
C [latex]\scriptsize =[/latex] chicken- .
- .
[latex]\scriptsize \begin{align*}P(\text{not burgers or chicken})&=\displaystyle \frac{{14}}{{100}}\\&=\displaystyle \frac{7}{{50}}\end{align*}[/latex]
- .
- R [latex]\scriptsize =[/latex] rugby
H [latex]\scriptsize =[/latex] hockey- .
- Calculate the value of [latex]\scriptsize \displaystyle x[/latex].
[latex]\scriptsize \begin{align*}600-56&=544\text{ number of learners who play R or H}\\288+372-x&=544\\\therefore x&=116\end{align*}[/latex] - No, playing rugby and playing hockey are not mutually exclusive since [latex]\scriptsize \text{R}\cap \text{H=116}\ne 0[/latex].
- .
Media Attributions
- Fig 1 Venn diagram samples space options © DHET is licensed under a CC BY (Attribution) license
- Fig 2 Example 2.1 © DHET is licensed under a CC BY (Attribution) license
- Fig 3 Ex 2.2 © DHET is licensed under a CC BY (Attribution) license
- Fig 4 Ex 2.2B © DHET is licensed under a CC BY (Attribution) license
- Fig 5 Ex 2.3 © DHET is licensed under a CC BY (Attribution) license
- Fig 6 Exercise 2.1 Q1 Ans © DHET is licensed under a CC BY (Attribution) license
- Fig 7 Exercise 2.1 Q2 Ans © DHET is licensed under a CC BY (Attribution) license
- Fig 8 Exercise 2.1 Q3 Ans © DHET is licensed under a CC BY (Attribution) license
- Fig 9 Assess Q1 Ans © DHET is licensed under a CC BY (Attribution) license
- Fig 10 Assess Q2 Ans © DHET is licensed under a CC BY (Attribution) license
- Fig 11 Assess Q3 Ans © DHET is licensed under a CC BY (Attribution) license
- Fig 12 Assess Q4 Ans © DHET is licensed under a CC BY (Attribution) license
